
From Data to Decisions: A Guide to Product Analytics That Drive Action
How to Stop Drowning in Dashboards and Start Making Data-Driven Decisions


"We should look at the data."
Sound familiar? If you've spent any time in product management, you've probably heard this phrase more times than you can count—maybe you've even said it yourself. And hey, it sounds smart, responsible, and totally professional. But here's the thing: most teams are absolutely drowning in data while somehow still starving for insights that actually help them make better decisions.
If you're a junior product manager, the world of product analytics probably feels pretty intimidating right now. You know data matters (everyone keeps telling you that), but turning a bunch of numbers into meaningful action? That's way harder than it looks. I've watched so many promising PMs get stuck right here—either avoiding data like the plague or getting completely lost in metrics without ever finding anything they can actually act on.
Let me share a practical approach to product analytics that's specifically designed for people early in their PM journey. This isn't about turning you into a data scientist overnight. It's about developing the kind of analytical thinking that separates the really exceptional product managers from everyone else.
Stop Staring at Dashboards: The Decision-First Approach
Here's the biggest mistake I see junior as well as some senior PMs make: they start with whatever data happens to be available instead of starting with the decisions they actually need to make. They'll spend hours clicking through dashboards, hoping some magical insight will just appear. Spoiler alert: it almost never works that way.
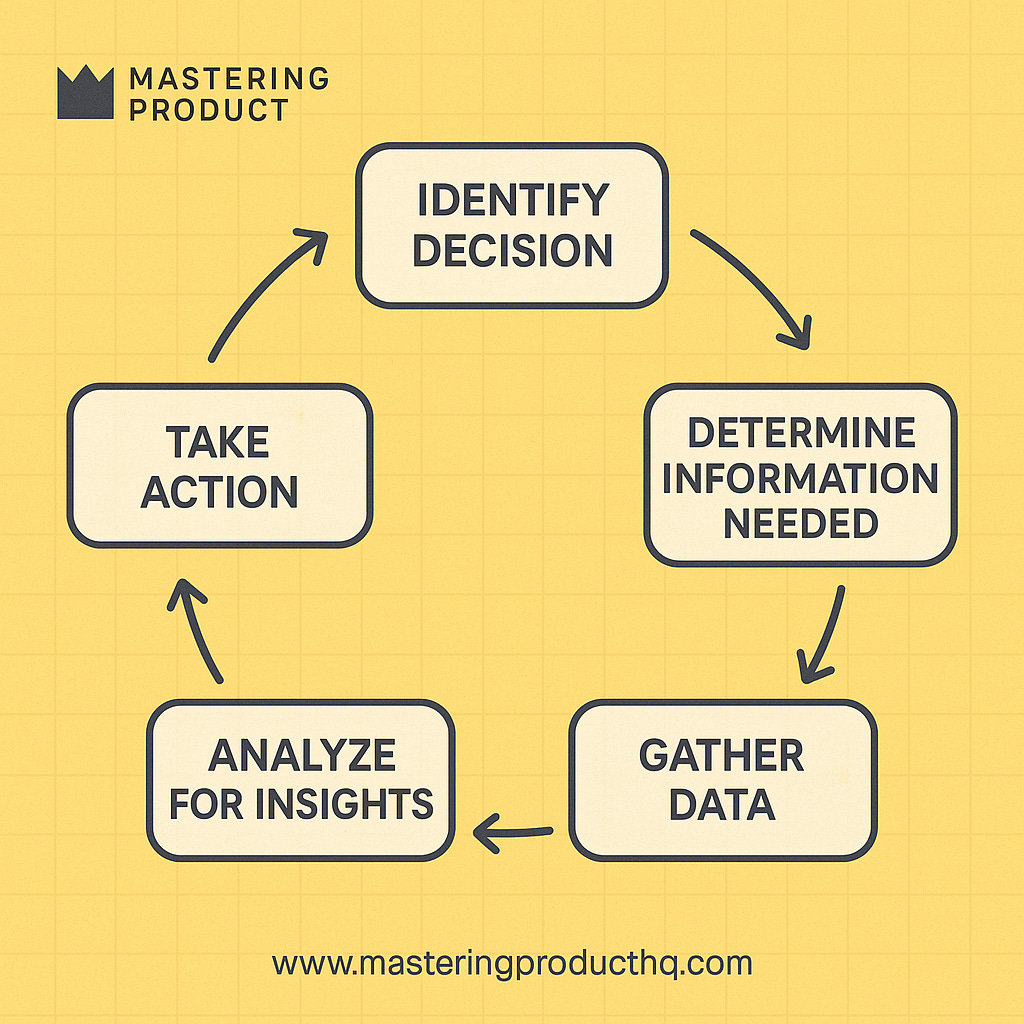
Instead, try what I call the "decision-first" approach:
Start with the specific decision you need to make → Figure out what information would actually help → Go find or create that specific information → Run the right analysis to extract insights → Connect those insights directly to action
Take Booking.com, for example. When a product team responsible for search experience and they wanted to improve their search-booking experience, that team doesn’t just start poking around at random metrics. They begin with specific decisions: Which parts of our booking flow should we redesign first? What exact friction points should we tackle? This focused approach guides everything they did with data, leading to targeted improvements that boosted conversion.
The Five Types of Questions Your Data Can Actually Answer
To make this decision-first approach work, you need to understand what kinds of questions analytics can realistically answer. I've found that pretty much every product analytics question falls into one of five buckets:
1. Descriptive: What's happening right now?
These are your baseline questions—the ones that help you understand what users are actually doing with your product.
Think questions like:
How many users finished onboarding last month?
What's the average time people spend in our app per session?
Which features get used the most (and least)?
The techniques here are pretty straightforward: basic metrics tracking, breaking users into segments, and creating feature usage heat maps.
Pictory did this well- They used detailed user segmentation based on location, behaviors, industry, and job title to create an Ideal Customer Profile, resulting in a 16% increase in conversions and 15% reduction in churn
2. Diagnostic: Why is this happening?
Once you know what's happening, you naturally want to understand why.
Questions like:
Why did our conversion rates tank after the last release?
Why do users bail out at step 3 of checkout?
Why do power users love feature X but completely ignore feature Y?
For this, you'll use funnel analysis, compare different user groups, look for correlations, and dive into user session recordings.
Duolingo noticed that many users felt too much pressure to maintain daily streaks, which led to frustration and drop-off. By redesigning their streak system so that completing just one lesson per day would maintain the streak, they made learning less stressful. This change resulted in a 40% increase in users maintaining a 7-day streak or more, significantly boosting retention and engagement.
3. Predictive: What's likely to happen next?
These questions help you get ahead of problems before they become real problems.
Like:
Which users are probably going to churn next month?
How will this feature change likely impact our key metrics?
What usage patterns predict long-term retention?
You'll use trend analysis, retention cohort analysis, and when you have enough data, some predictive modeling.
Spotify discovered through data analysis that users with more diverse listening habits (listening to a wider variety of genres and artists) have significantly lower churn rates than users who listen to narrow, specialized content. Among the least active users, specialists churn at a rate 30 percentage points higher than the global average, while generalists churn only 5 percentage points above average. This insight helps Spotify understand which user segments are at higher risk of cancellation.
4. Comparative: Which option works better?
These help you choose between alternatives—super important for making good product decisions.
Questions like:
Which design variant performs better for our target users?
How do we stack up against industry benchmarks?
Which user segment responds better to this feature?
This is where A/B testing, multivariate testing, and competitive benchmarking really shine.
Netflix famously tests multiple thumbnail images for the same content and sometimes sees conversion differences of 20-30% between variants. This comparative analysis directly shapes how they promote content to maximize engagement.
5. Prescriptive: What should we actually do?
These are the money questions—the ones that help you figure out your next moves based on everything you've learned.
Like:
Which features should we prioritize in our next release?
How should we change our onboarding flow to improve activation?
Which user segments should we target with this new capability?
You'll use impact modeling, opportunity sizing, and data-informed prioritization frameworks.
Slack employs product analytics to segment users based on team size, industry, and usage patterns, enabling them to personalize communications, feature recommendations, and support interactions for different user groups. They combine user behavior analysis with A/B testing of user interfaces and feature implementations to measure impact on engagement. For instance, Slack experiments with different notification presentation methods to determine which approach leads to higher user responsiveness, then uses these insights to refine their notification system
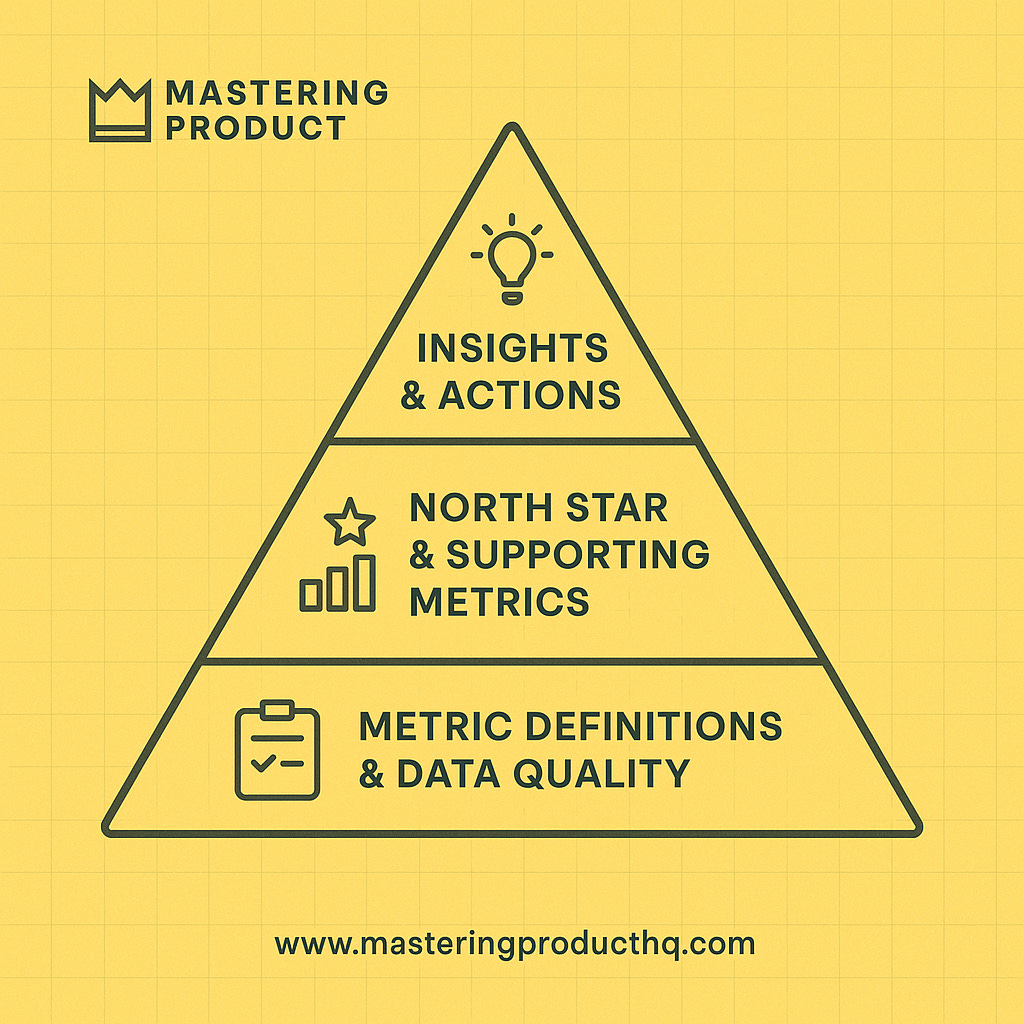
Getting Your Analytics Foundation Right
Before you can extract meaningful insights, you need to set up the right foundation. Here's what every junior PM should establish:
Define Your North Star and Supporting Metrics
Start by getting crystal clear on:
North Star Metric: The single most important metric that shows you're delivering value to users and achieving business success
Supporting Metrics: The key metrics that actually drive your North Star
Counter Metrics: Metrics you watch to make sure you're not improving your main metrics at the expense of other important stuff
Dropbox focuses on user retention as a core North Star in the highly competitive cloud storage market. They employ advanced analytics to track supporting metrics such as frequency of file uploads, sharing activities, and collaboration patterns. By understanding these behaviors, Dropbox segments users into different cohorts and tailors experiences for each group—frequent collaborators receive enhanced sharing features, while users who primarily use Dropbox for storage get improved file organization tools.
Get Your Metric Definitions Straight
For every important metric, document:
Exactly what it means
How it's calculated
What "good" looks like
Any known limitations
Who's responsible for it
This prevents the super common problem where different team members interpret the same metrics completely differently.
Leading tech companies create detailed metric definition documents for every key metric, specifying exactly what each metric means, how it's calculated, what "good" looks like, any known limitations, and who's responsible for it. This prevents the common problem where different team members interpret the same metrics completely differently.
Practical Techniques That Don't Require a PhD in Data Science
With your foundation in place, here are specific analytical techniques that work great for PMs:
Funnel Analysis: Finding Where Users Get Stuck
Funnel analysis tracks users through a sequence of actions and shows you exactly where they drop off.
Here's how to use it:
Define the steps in your key user journeys
Calculate conversion rates between each step
Identify steps with unusually high drop-off rates
Dig deeper into those specific problem areas
Cohort Analysis: Understanding How Users Evolve
Cohort analysis groups users based on when they started using your product and tracks their behavior over time.
How to make it work:
Group users by when they joined (weekly or monthly cohorts)
Track key metrics for each cohort over time (retention, engagement, etc.)
Compare cohorts to spot trends or improvements
Use cohort analysis to measure the real impact of product changes
Segmentation: Finding Patterns Across Different User Groups
Segmentation means dividing your user base into meaningful groups to identify differences in behavior and needs.
Here's the process:
Identify potential ways to segment (acquisition source, user role, usage frequency, etc.)
Compare key metrics across segments
Look for significant differences that suggest different needs or behaviors
Use these insights to tailor experiences for different segments
From Numbers to Stories: Making Data Compelling
Having data isn't enough—you need to transform it into compelling insights that actually drive action. Here's how:
Structure Your Data Story
When you're presenting analytics insights, follow this structure:
Context: What question were we trying to answer and why does it matter?
Observation: What pattern did we see in the data?
Insight: What does this tell us about user behavior or product performance?
Action: What specific steps should we take based on this insight?
Visualize Effectively
Choose visualizations that actually highlight your key points:
Line charts: For trends over time
Bar charts: For comparing different categories
Funnel charts: For conversion processes
Scatter plots: For exploring relationships
Heat maps: For engagement patterns
Keep it simple and focused on the main insight.
Effective data visualization guidelines emphasize clarity over complexity, using consistent color schemes where red indicates problems and green indicates positive outcomes, making insights immediately recognizable.

Avoiding the Traps That Trip Up Junior PMs
Being aware of these common pitfalls will help you build credibility fast:
Don't Confuse Correlation with Causation
Just because two metrics move together doesn't mean one causes the other. Look for natural experiments or A/B tests that actually isolate variables. Be careful with your language—say "associated with" rather than "caused" unless you have real causal evidence.
Watch Out for Selection Bias
Always consider who isn't in your dataset. Be particularly careful with feedback, survey responses, and power users, which often represent only a tiny segment of your user base.
Spotify initially thought their service was already effective for music discovery, focusing on features that worked well for early adopters and music enthusiasts within the company. However, they discovered this approach didn't serve mainstream "lean-back" users who lacked the time or knowledge that power users had. This led Spotify to shift from a model where users did the work by following people and playlists, to a recommendations-based model where the service does the work based on listening history.
Building Your Analytics Skills: A 30-Day Action Plan
Here's a practical plan to strengthen your analytics capabilities over the next month:
Days 1-7: Assessment and Foundation
Identify your product's current North Star and supporting metrics
Document any gaps or inconsistencies in measurement
Schedule time with a data analyst to understand current capabilities
Create a list of the top 5 decisions your team needs to make
Days 8-14: Data Exploration
Learn to use your company's analytics tools
Create basic dashboards for your key metrics
Analyze one key user journey using funnel analysis
Compare behavior across 2-3 key user segments
Days 15-21: From Data to Insights
Identify one unexpected pattern in your product data
Form a hypothesis about what's causing this pattern
Design a simple test of your hypothesis
Present your findings to your team for feedback
Days 22-30: Driving Action
Connect your insights to a specific product decision
Create a simple data story that makes the case for action
Implement a measurement plan for your next feature
Establish a weekly analytics review routine
The Real Goal: Better Decisions, Not Better Dashboards
Here's the thing—product analytics isn't really about mastering tools or memorizing techniques. It's about developing an analytical mindset that makes all aspects of your work better:
Ask better questions: Move from vague stuff like "How are users liking our product?" to specific, actionable questions like "Which user segments struggle with feature X, and what specific behaviors show us their difficulties?"
Get comfortable with uncertainty: Product data is always incomplete and imperfect. Learn to make good decisions with imperfect information while continuously improving your understanding.
Stay healthily skeptical: Question surprising results, check your assumptions, and look for alternative explanations before acting on data.
Balance data and intuition: Use data to inform decisions, not make them for you. The best product managers combine analytical insights with domain expertise and user empathy.
Your Analytics Journey Starts Now
As PM, developing strong analytics skills will absolutely accelerate your career growth. But remember—the goal isn't to become a data analyst. The goal is to make better product decisions that create real value for users and your business.
The most successful product managers I've mentored don't just report metrics—they transform data into insights and insights into action. They know which questions to ask, which analyses to run, which patterns to look for, and most importantly, how to tell compelling data stories that actually drive decisions.
By following the approaches in this article, you'll avoid the common traps of either ignoring data completely or getting totally lost in it. Instead, you'll develop the analytical mindset that turns data from a buzzword into a genuine superpower for your product career.
What analytics questions are you wrestling with right now in your product role? What obstacles have you faced in turning data into action? I'd love to hear about your experiences.
I really liked this article. It is very detailed and comprehensive.
Great article Sohaib, thanks for sharing.
I feel that even some Senior PMs and managers still lack this analytical mindset. In your view, what are the best ways to present yourself and lead this high-level discussion with directors and managers to extract real business insights?